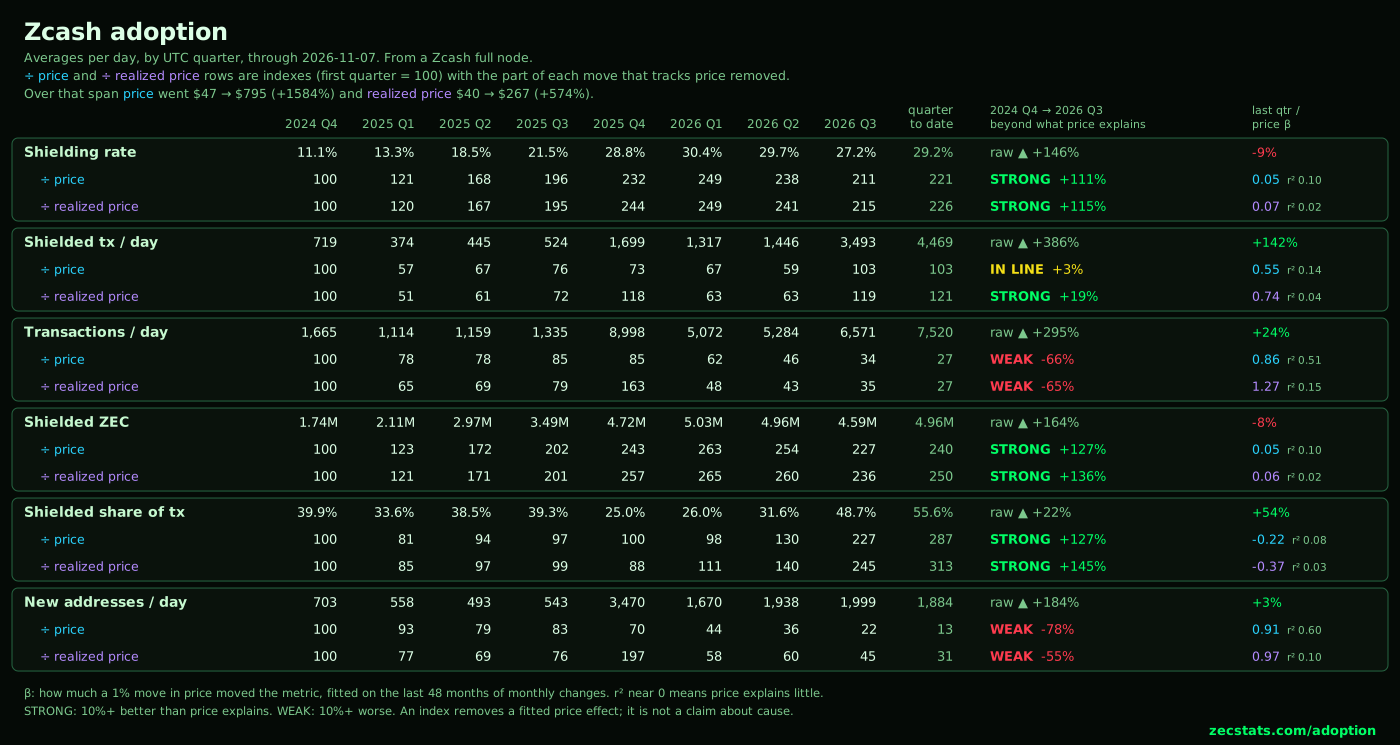
Six numbers that say whether more people use Zcash, and use it privately. Each is shown raw, then twice more with the effect of price taken out, so a bull market does not pass for adoption.
| Metric | 2024 Q4 | 2025 Q1 | 2025 Q2 | 2025 Q3 | 2025 Q4 | 2026 Q1 | 2026 Q2 | 2026 Q3 | Quarter to date | Price β | Realized β |
|---|---|---|---|---|---|---|---|---|---|---|---|
| Shielding rate | 11.1% | 13.3% | 18.5% | 21.5% | 28.8% | 30.4% | 29.7% | 27.2% | 29.2% | 0.05 (r² 0.10, 47 mo) | 0.07 (r² 0.02, 47 mo) |
| Shielded tx / day | 719 | 374 | 445 | 524 | 1,699 | 1,317 | 1,446 | 3,493 | 4,469 | 0.55 (r² 0.14, 47 mo) | 0.74 (r² 0.04, 47 mo) |
| Transactions / day | 1,665 | 1,114 | 1,159 | 1,335 | 8,998 | 5,072 | 5,284 | 6,571 | 7,520 | 0.86 (r² 0.51, 47 mo) | 1.27 (r² 0.15, 47 mo) |
| Shielded ZEC | 1.74M | 2.11M | 2.97M | 3.49M | 4.72M | 5.03M | 4.96M | 4.59M | 4.96M | 0.05 (r² 0.10, 47 mo) | 0.06 (r² 0.02, 47 mo) |
| Shielded share of tx | 39.9% | 33.6% | 38.5% | 39.3% | 25.0% | 26.0% | 31.6% | 48.7% | 55.6% | -0.22 (r² 0.08, 47 mo) | -0.37 (r² 0.03, 47 mo) |
| New addresses / day | 703 | 558 | 493 | 543 | 3,470 | 1,670 | 1,938 | 1,999 | 1,884 | 0.91 (r² 0.60, 47 mo) | 0.97 (r² 0.10, 47 mo) |
| Monthly average | 2025-11 | 2025-12 | 2026-01 | 2026-02 | 2026-03 | 2026-04 | 2026-05 | 2026-06 | 2026-07 | 2026-08 | 2026-09 | 2026-10 |
|---|---|---|---|---|---|---|---|---|---|---|---|---|
| Shielding rate | 29.6% | 29.7% | 29.9% | 30.4% | 30.8% | 31.1% | 30.8% | 27.2% | 26.0% | 26.7% | 28.9% | 29.2% |
| Shielded tx / day | 2,103 | 1,291 | 1,239 | 1,488 | 1,240 | 1,272 | 1,647 | 1,412 | 1,396 | 2,151 | 7,046 | 4,503 |
| Transactions / day | 15.8k | 5,303 | 5,502 | 5,111 | 4,605 | 4,715 | 7,484 | 3,578 | 3,264 | 4,524 | 12.1k | 7,563 |
| Shielded ZEC | 4.85M | 4.88M | 4.94M | 5.04M | 5.11M | 5.17M | 5.15M | 4.56M | 4.38M | 4.50M | 4.89M | 4.96M |
| Shielded share of tx | 20.3% | 25.1% | 22.8% | 28.1% | 27.2% | 28.9% | 26.6% | 39.3% | 41.8% | 49.5% | 55.0% | 55.3% |
| New addresses / day | 4,772 | 2,384 | 2,017 | 1,582 | 1,402 | 1,393 | 2,866 | 1,525 | 1,134 | 1,409 | 3,502 | 1,924 |
For each metric we fit one number, β: how much the metric moved, in percent, for each 1% move in price. It is fitted on monthly changes over the last 48 months. Changes are used, not levels, because two things that both grow will always look related in levels.
The index for a period is the metric's change since the first quarter shown, with the price change over the same time multiplied by β and taken out. If the index rises while price falls, use grew on its own. An r² near zero means price explained little of the monthly moves, and the index is close to the raw change.
The realized price rows do the same against the realized price: the average price at which every ZEC last moved. It moves much more slowly than the market price, so it removes the long-run cost of holding ZEC rather than the daily mood.
Shielding rate is the share of all ZEC held in shielded pools. Shielded ZEC is the same holdings in coins. Shielded tx / day counts transactions that touch a shielded pool. Transactions / day counts all of them, less the one coinbase per block. Shielded share of tx divides the two. New addresses / day counts transparent addresses paid for the first time, which is the nearest on-chain sign of new users. One person can have many addresses, so it is not a user count.
Since NU7 (November 2026) blocks come every 25 seconds, three times as often. Each block carries fewer transactions, but the counts here are per day, so the change does not move them.