Every Zcash number on one page, computed from a full node we run — not copied from an exchange API. 60 charts, updated daily.
Buy ZEC with BTC, ETH, USDC or SOL, sent to your own wallet. No account.Buy ZEC →
As of 11 November 2026, one ZEC buys 0.01326 BTC — up 321% over five years, up 209% on the year and up 72% over three months. Five years ago it bought 0.003149 BTC.
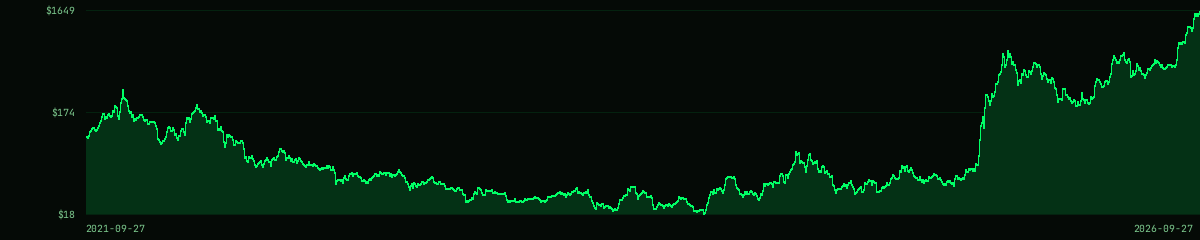
In dollars that is $981.99 a coin (up 122% on the year and up 100% over three months), a market cap of $16.7B — 1.1% of Bitcoin's. Spot sits 2.5× above the realized price of $387 — the average price at which a ZEC last crossed a pool boundary — so the typical coin is held at a gain.
Behind it: 29.3% of all ZEC — 4.99M ZEC, $4.9B — sits in shielded pools, against 29.4% a year ago and 8.0% five years ago. Ironwood, the current shielded pool, holds 4.24M ZEC, with 321k ZEC still in Orchard, its predecessor, crossing the turnstile.
Transactions average 12,728 a day (up 8% on the year and up 155% over three months), of which 7,070 — 56% — are shielded, against 23% a year ago. Transparent addresses are being paid for the first time at 1,742 a day (down 72% on the year and up 94% over three months). An address is not a person: wallets derive a fresh one per payment received.
17.0M of 21M ZEC has been issued, 81% of the cap.
Network security: the hashrate is 33.4 GSol/s, up 5.1× over five years and up 178% on the year. Block rewards run $1.5M a day — 1,502 ZEC of coinbase, of which 2.0 ZEC — 0.1% — is transaction fees rather than new issuance. Users paid $70.7k in fees over the 30 days to 10 November 2026 — up 16× over five years and up 8% on the year.
Against Bitcoin, ZEC changes hands at 0.01326 BTC — down 7.4% over 24 hours and down 9.2% over 30 days.
In dollars, over the last 24 hours ZEC is down 6.8% at $981.99, in a 24h range of $962.85–$1,053.60, a market cap of $16.7B on $1.0B of 24h trading volume.
Transactions are up 44% week-over-week (~12,728/day); shielded transactions are up to 56% of all activity (+4 pts week-over-week); network hashrate is up 6% (33.0 GSol/s); the shielded pool gained 9,599 ZEC this week.
Transaction fees came to $16.9k over the last seven days, up 8% on the week before. On 10 November 2026 users paid $4.6k, up 162% on the day.
Notable: ZEC is down 24.1% over the past week, now $981.99 (was $1,293.41) (11 November 2026); Fully-shielded transactions surge to 14,950 today (+3.1σ vs ~3,283/day).
The most-viewed charts over the last 7 days.
How many ZEC exist, and how fast new ones arrive.
What the market pays for ZEC, and how it tracks Bitcoin.
The core product — how much ZEC sits in shielded pools, and how fast it is being shielded.
How much the chain is actually used, and for what.
Who holds ZEC and for how long — the transparent side, where age is readable.
What it costs to attack the chain.
Leverage, positioning, and what it costs to hold either side.
Where ZEC trades, and how much of the market it is.
How ZEC moves between chains.