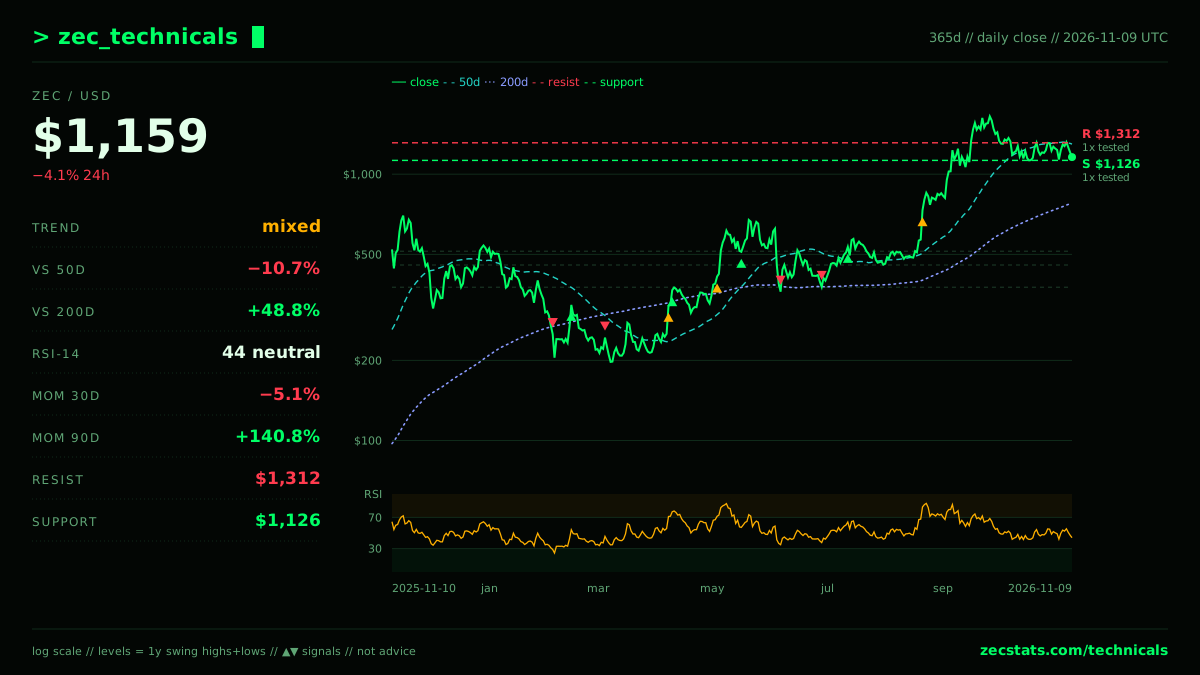
Trend, momentum and price levels for ZEC from daily closes: moving averages, RSI-14, returns, and the past year's support and resistance. Every signal the account posts is logged below.
| Metric | Value | Note |
|---|---|---|
| Close | $1,159 | Nov 9, 2026 |
| 20-day average | $1,242 | close −6.6% vs average |
| 50-day average | $1,298 | close −10.7% vs average |
| 200-day average | $779 | close +48.8% vs average |
| Trend | Mixed | close vs 50-day vs 200-day |
| RSI-14 | 43.9 | neutral |
| 1-day return | −4.1% | from $1,209 |
| 7-day return | +2.0% | from $1,136 |
| 30-day return | −5.1% | from $1,222 |
| 90-day return | +140.8% | from $481 |
| 1-year return | +88.4% | from $615 |
Counted, not fitted: of the past days like today, how often ZEC was higher 30 days later, beside the same count over every day. Neighbouring days overlap, so N days are fewer independent cases than N. Not a forecast.
| Past days | N | Higher 30d later | Median 30d |
|---|---|---|---|
| Any day (base rate) | 3,635 | 49% | −0.6% |
| Like today: pullback, RSI 40s | 270 | 51% | +1.4% |
| After: golden cross | 11 | 36% | −6.2% |
| After: death cross | 10 | 50% | +6.3% |
| After: close above 200-day | 16 | 69% | +9.6% |
| After: close below 200-day | 29 | 48% | −2.3% |
| After: rsi above 70 | 44 | 59% | +12.8% |
| After: rsi below 30 | 27 | 41% | −5.6% |
| After: broke resistance | 33 | 48% | −5.4% |
| After: broke support | 42 | 43% | −9.4% |
| Level | Touches | Last swing | From close |
|---|---|---|---|
| $1,649 | 1 | 2026-09-26 | +42.3% |
| $1,312 ← resistance | 1 | 2026-10-21 | +13.2% |
| $1,126 ← support | 1 | 2026-10-17 | −2.8% |
| $851 | 1 | 2026-08-23 | −26.6% |
| $699 | 1 | 2025-11-16 | −39.7% |
| $673 | 1 | 2026-05-20 | −41.9% |
| $614 | 1 | 2026-05-08 | −47.0% |
| $571 | 1 | 2026-07-15 | −50.7% |
| $540 | 1 | 2025-12-29 | −53.4% |
| $514 | 3 | 2026-08-05 | −55.7% |
| $456 | 2 | 2026-07-31 | −60.6% |
| $377 | 2 | 2026-06-28 | −67.5% |
| $362 | 1 | 2026-06-06 | −68.8% |
| $323 | 1 | 2026-02-14 | −72.1% |
| $313 | 1 | 2025-12-02 | −73.0% |
| $302 | 1 | 2026-04-19 | −74.0% |
| $277 | 1 | 2026-03-16 | −76.1% |
| $213 | 1 | 2026-03-28 | −81.6% |
| $205 | 1 | 2026-02-05 | −82.3% |
| $197 | 1 | 2026-03-07 | −83.0% |
| Day | Signal | Close | Line / level | Close today vs then |
|---|---|---|---|---|
| 2026-08-21 | RSI above 70 | $733 | RSI 83 | +58.2% |
| 2026-07-12 | Broke resistance | $534 | $515 (2×) | +117.2% |
| 2026-06-28 | Close below 200-day | $377 | $378 | +207.1% |
| 2026-06-06 | Close below 200-day | $362 | $380 | +220.2% |
| 2026-05-16 | Golden cross | $511 | $376 | +126.6% |
| 2026-05-03 | RSI above 70 | $413 | RSI 71 | +180.6% |
| 2026-04-09 | Close above 200-day | $367 | $332 | +216.0% |
| 2026-04-07 | RSI above 70 | $321 | RSI 71 | +261.4% |
| 2026-03-04 | Death cross | $244 | $297 | +375.8% |
| 2026-02-14 | Close above 200-day | $323 | $278 | +258.6% |
| 2026-02-04 | RSI below 30 | $251 | RSI 29 | +361.7% |
| 2026-02-04 | Close below 200-day | $251 | $268 | +361.7% |
The 50-day and 200-day averages are simple averages of the last 50 and 200 daily closes (UTC days; today is left out until it closes). A golden cross is the 50-day rising above the 200-day, a death cross the reverse. A close above or below the 200-day counts as a signal only after ten closes on the other side, so a price that chops around the line does not fire again and again.
The Relative Strength Index compares the average size of up days with down days over 14 days (Wilder's smoothing), on a 0–100 scale. Above 70 is called overbought and below 30 oversold. In a strong trend RSI can stay there for weeks, so it says how stretched a move is, not that it will end.
A swing is a close that is the highest or lowest of the ten days either side of it. Swings from the last year within 3% of each other merge into one level, and its touches are how many swings it holds. Resistance is the nearest level above the close and support the nearest below. A close more than 1% through a level touched at least twice, after ten closes on the near side of it, is logged as a break, using the levels known the day before.
These are descriptions of the price series, not forecasts or advice. For on-chain valuation see MVRV and the realized price; for the model that weighs these signals against on-chain data, /signals.